
What Is the Risk-to-Reward Ratio in Trading?

Author
Hossein Haghshenas

Expert review
Mohammadreza Minaei
Published
 2026/10/21
Updated
2026/10/26
Reading time
5 دقیقه


It may have happened to you too: most of your trades, by count, close in profit, yet your account balance at the end of the period is lower than at the start. If we look closely, the reason is that a few large losses can wipe out the profit of many trades. That is why, before entering a trade, we need to weigh not only the probability of success but also the size of the potential profit and loss. The risk-to-reward ratio answers exactly this question: how much capital should we put at risk to reach the profit we want? This article focuses on that question and examines the concept of the risk-to-reward ratio and how to measure it.
What is the risk-to-reward ratio (Risk to Reward) and why does it matter in trading?
Simply put, the risk-to-reward ratio compares a trade's potential loss up to the stop loss with its potential profit up to the take profit. For example, if in a trade you accept a possible loss of $100 and set your profit target at $200, your risk-to-reward ratio is 1 to 2; that is, for every unit of risk, you are targeting two units of profit.
In this definition, risk is the planned loss up to the stop loss, not the total amount of money you put into the trade. Of course, the actual loss may differ from this amount due to slippage or trading costs.
The importance of the risk-to-reward ratio becomes clear when you look at several trades together over a period of time and have set a profit target for yourself based on them. If the profit of each winning trade is 2 times the loss of each losing trade, you don't need two wins to make up for one loss; a single win can cover the loss of two trades, before costs.
The risk-to-reward ratio formula and how to calculate it, explained simply
To calculate the risk-to-reward ratio, you need 3 numbers:
entry price, stop loss and take profit
Using the 3 numbers above, the risk-to-reward ratio is obtained as follows:
[Entry - Stop Loss] = Risk
[Take Profit - Entry] = Reward
R/R = Risk / Reward
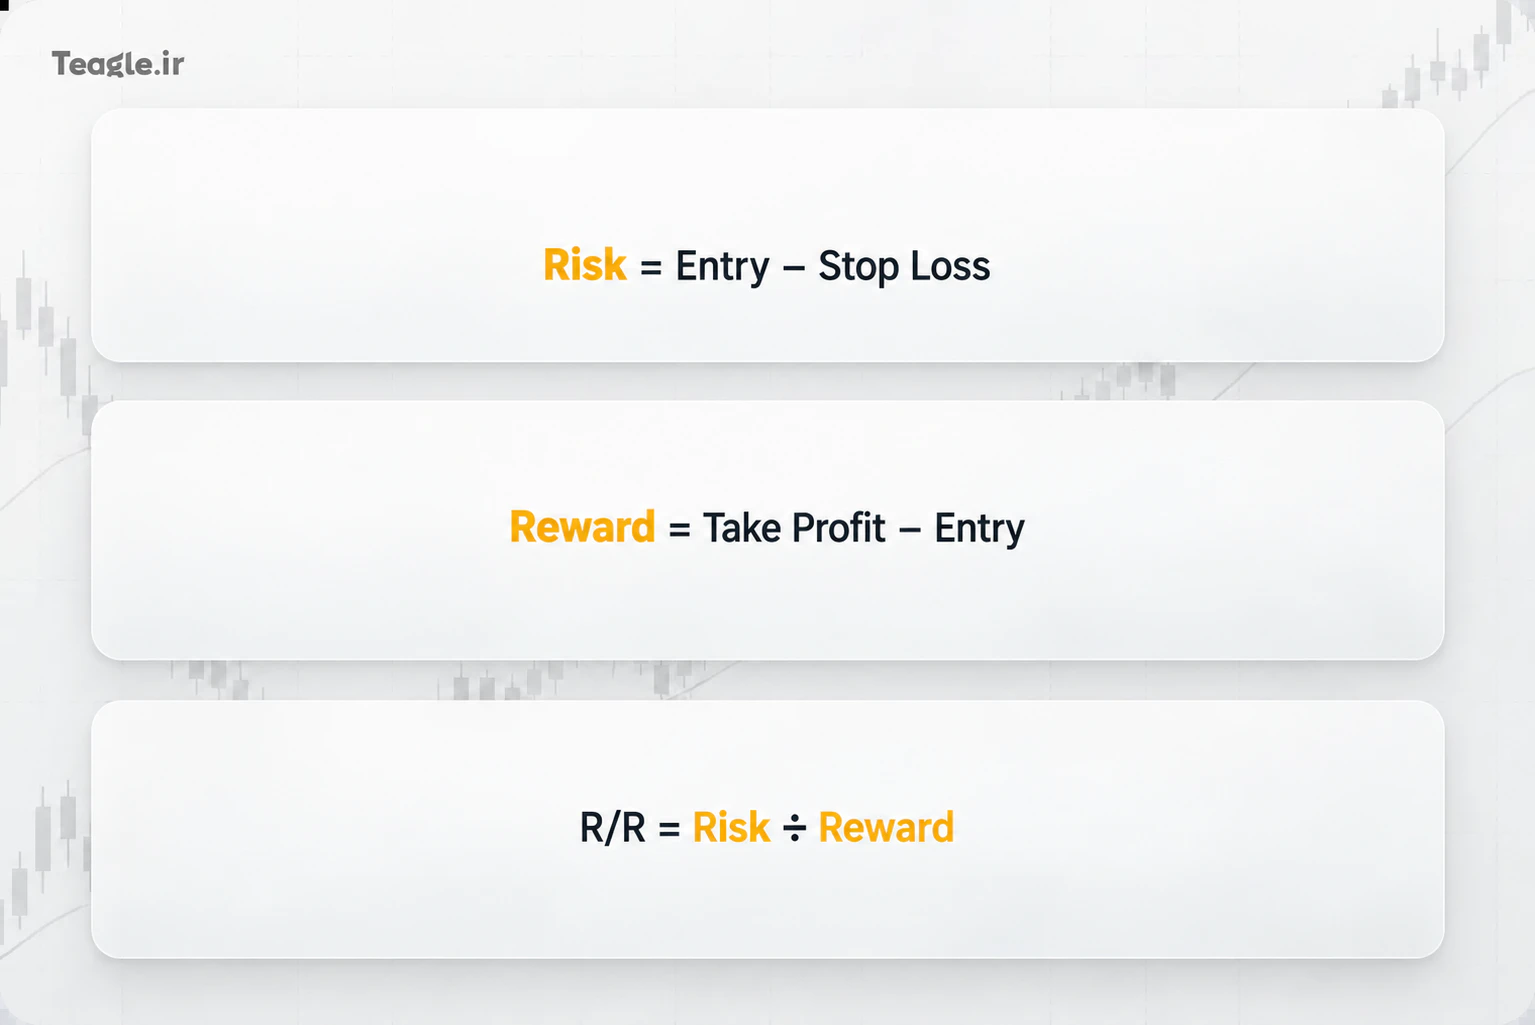
Suppose the distance from entry to the stop loss is 10 units and the distance from entry to the take profit is 20 units. Risk divided by reward equals 0.5, and we write the ratio as 1 to 2 . In other words:
Risk to reward of 1 to 2 = profit target equal to twice the risk
A practical example of calculating the R/R ratio in trading
Suppose you plan to buy a cryptocurrency at a hypothetical price of $100. You set the stop loss at $95 and the take profit at $110. We have the following numbers:
|
Trade details |
Value |
|
Entry price |
$100 |
|
Stop loss |
$95 |
|
Take profit |
$110 |
|
Risk per unit |
$5 |
|
Profit target per unit |
$10 |
|
Risk-to-reward ratio |
1 to 2 |
Based on these calculations, the risk-to-reward ratio is 1 to 2. Now, if you buy 10 units of this asset ($1,000), your planned loss is $50 and your profit target is $100. Naturally, these figures do not account for fees and slippage. This example also clarifies the difference between trade size and trade risk: your trade size is $1,000, but the calculated loss up to the stop loss will be $50.
The hidden relationship between the risk-to-reward ratio and the win rate (Win Rate)
The win rate is the percentage of trades that close in profit. If 40 out of 100 trades are profitable, your win rate is 40 percent. But this number alone does not indicate profitability. In other words, alongside the profit we have made, we need to know how much we have lost on the losing trades.
To examine this relationship, we use a metric called «expectancy». Expectancy is the average expected result per trade:
Expectancy = (probability of winning × average profit) − (probability of losing × average loss)
In this formula, probabilities are entered as decimals. For example, a 40 percent win rate equals 0.4. If the profit from each win is twice the loss from each loss, the breakeven win rate is obtained from this formula:
Breakeven win rate = 1 ÷ (1 + profit-to-loss) × 100
At a risk-to-reward ratio of 1 to 2, the breakeven win rate is about 33.33 percent. In other words, this rate tells us that, before costs, winning about one-third of trades is enough to cover the losses of the rest.
Risk-to-reward ratio and win rate table
|
Risk-to-reward ratio |
Profit per win for every $100 lost per loss |
Breakeven win rate, before costs |
|
1 to 0.5 |
$50 |
66.67% |
|
1 to 1 |
$100 |
50% |
|
1 to 1.5 |
$150 |
40% |
|
1 to 2 |
$200 |
33.33% |
|
1 to 3 |
$300 |
25% |
|
1 to 4 |
$400 |
20% |
|
1 to 5 |
$500 |
16.67% |
Note that the figures in the table are calculated assuming a fixed loss on each losing trade and a fixed profit on each winning trade. To be profitable, the win rate must be above the exact breakeven value; fees and other costs also raise this threshold. For example, with 10 trades, four $200 wins and six $100 losses, the result is:
$800 profit − $600 loss = $200 profit before costs
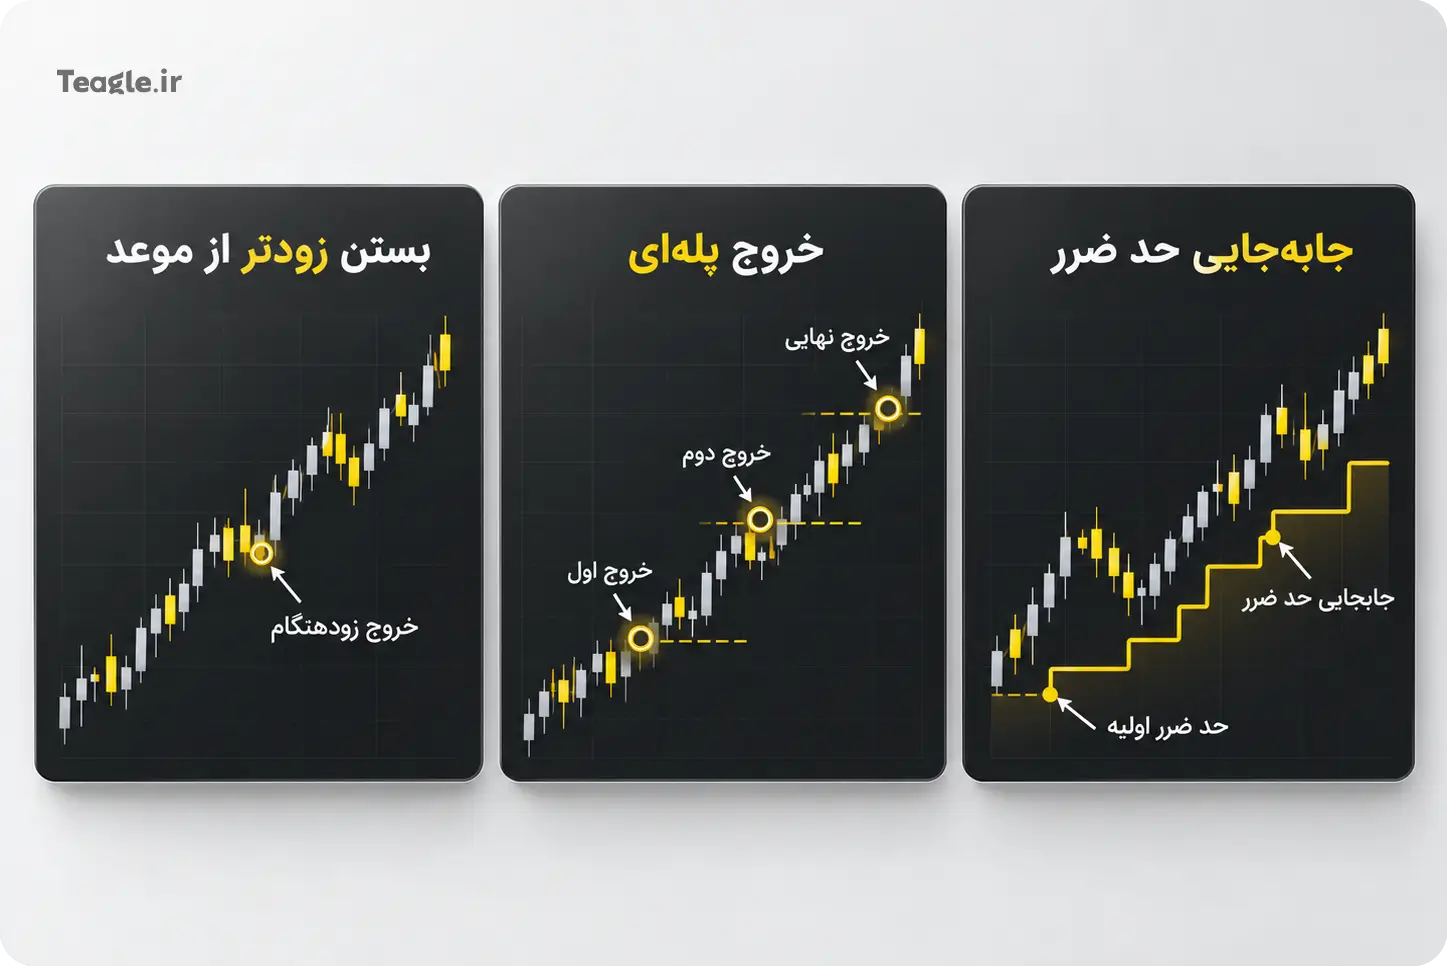
The key point is that when evaluating performance, you should use your actual profits and losses. If you open trades with a 1 to 3 target but often close them early, you cannot compare your win rate with the 1 to 3 row of the table. Partial exits and moving the stop loss also change the average result of your trades.
What is the best risk-to-reward ratio in financial markets?
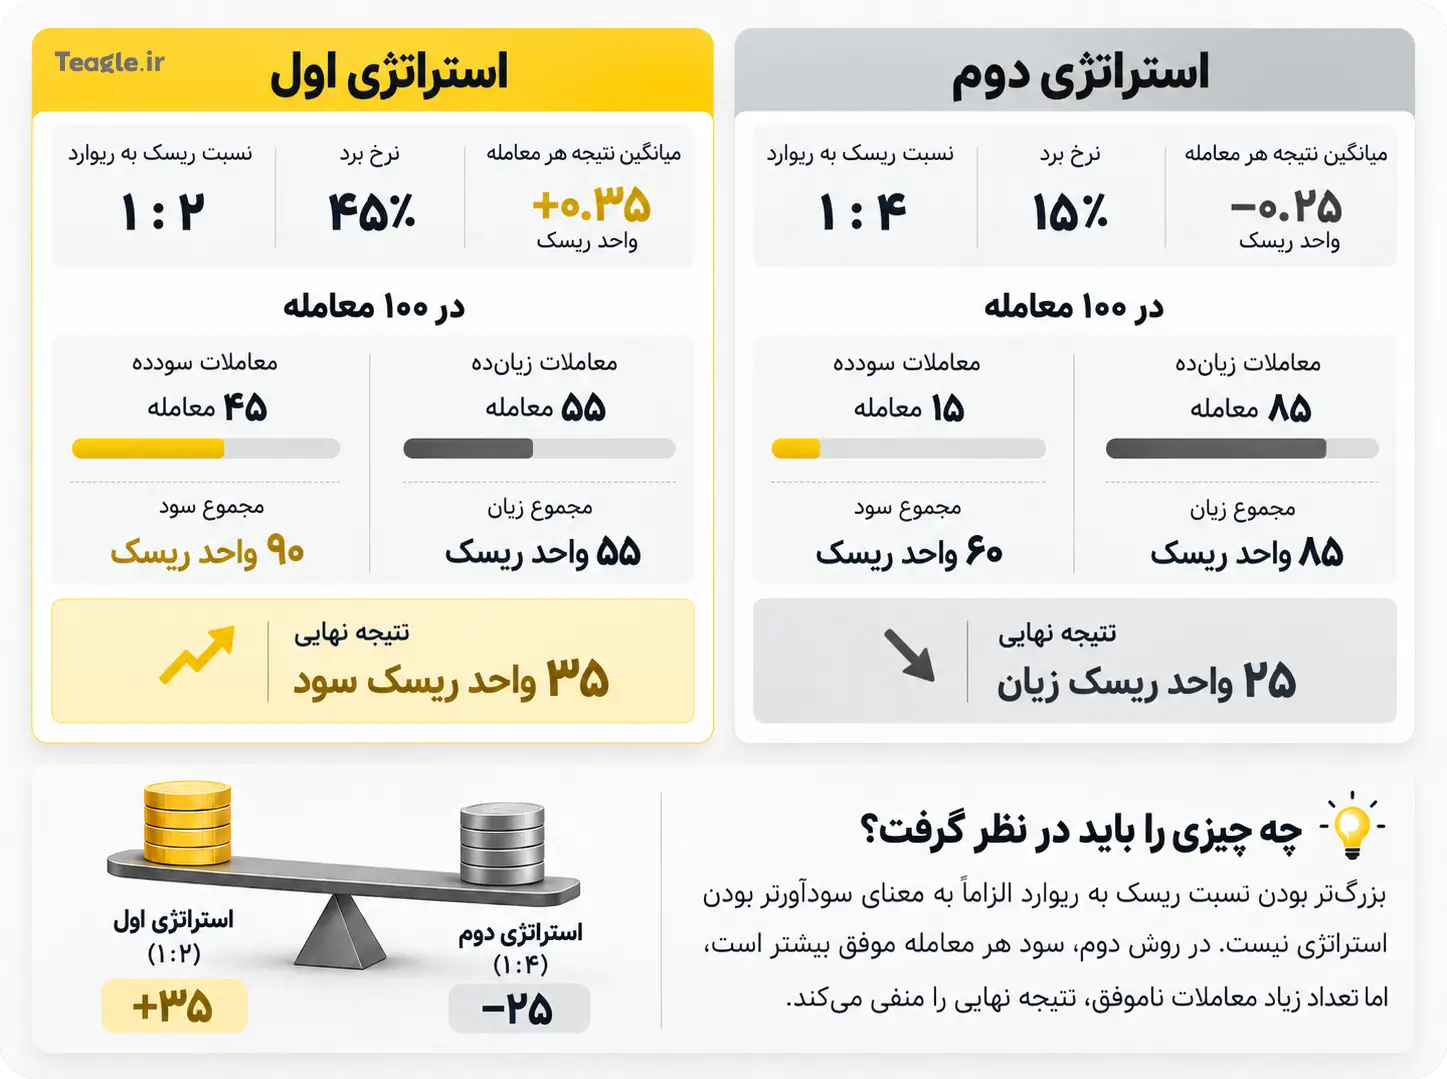
Given what we explained earlier, it is clear that the best risk-to-reward ratio is not a fixed number for all traders. The right ratio should be aligned with your actual win rate, exit method, trading costs and market conditions. To see the difference, consider two hypothetical methods. We assume the risk of each trade is one unit:
|
Trading method |
Realized risk-to-reward ratio |
Win rate |
Average result per trade, before costs |
|
Method one |
1 to 2 |
45% |
Positive 0.35 units of risk |
|
Method two |
1 to 4 |
15% |
Minus 0.25 units of risk |
The second approach makes a bigger profit on each win, but the number of losses makes its overall result negative. So choosing a strategy with a high risk-to-reward ratio just because the number looks attractive is not enough.
To find a suitable ratio, test several profit targets on historical data using the same entry rules and stop loss. Then see which one, after costs, has the better average result and a more tolerable drawdown. Testing on data that was not used to tune the strategy and practicing on a demo account help with a more realistic assessment. Note that this logic is the same in forex, crypto and the stock market. The differences lie in volatility, liquidity, costs and order execution conditions.
Tools for calculating risk to reward in TradingView and MetaTrader
You don't need complex software for basic calculations; a calculator or an Excel file is enough. The advantage of using risk-to-reward calculation software is that when you change the entry, stop loss or take profit, the result updates faster and the chance of manual error is lower.
Risk to reward in TradingView
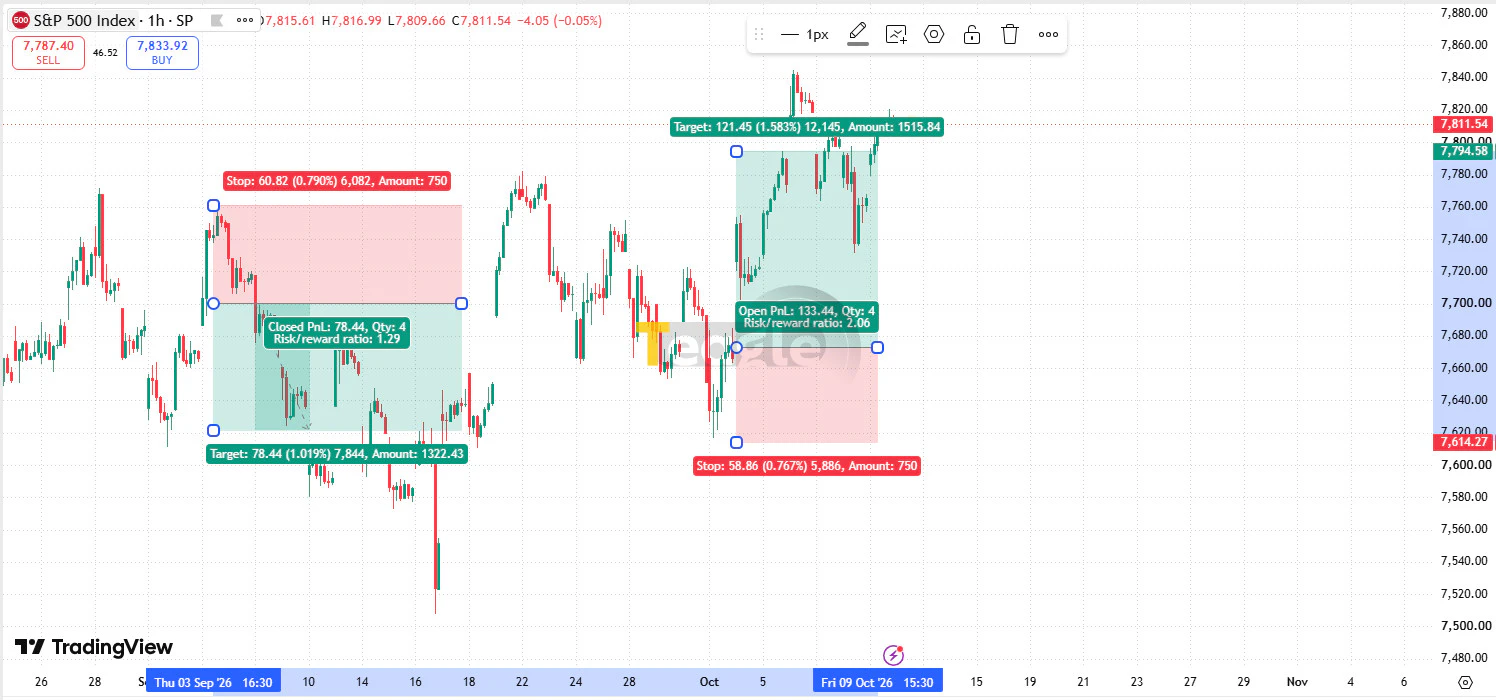
To display the risk-to-reward ratio in TradingView, you can use the Long Position drawing tool for buys and the Short Position tool for sells:
1. Choose the tool that matches the direction of your trade and place it on the chart.
2. Set the entry line at your desired price.
3. Drag the stop loss and take profit zones, or enter the prices in the tool's settings.
4. Read the ratio and the distance to each level.
The number shown in the tool's Risk/Reward Ratio field is reward divided by risk; so a value of 2 means a risk to reward of 1 to 2. Drawing this tool does not place a trade order by itself.
Risk to reward in MetaTrader
In MetaTrader you can set the entry price, Stop Loss and Take Profit and work out the ratio from the distance between these levels. In the desktop version of MetaTrader 5, when you drag trade levels on the chart, the potential profit or loss is also shown in the tooltip.
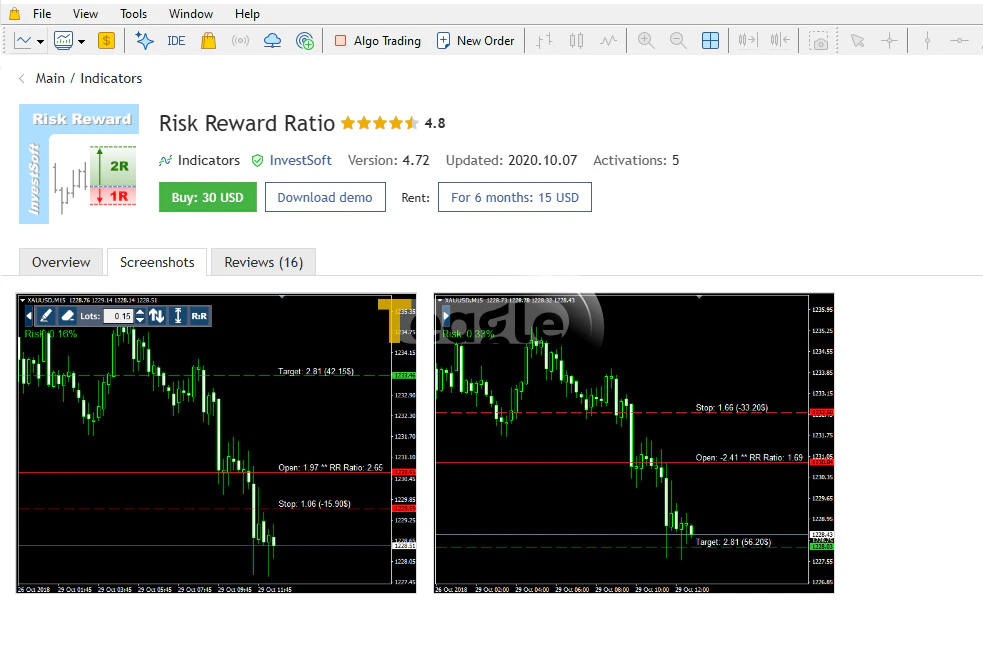
There are also add-on tools that display the ratio directly and calculate position size. For example, the MQL5 Market offers a product called Risk Reward Ratio which, according to its developer, calculates the ratio, the potential profit and loss, and the position size matching your chosen risk. This risk-to-reward indicator is a third-party add-on and should not be considered a default MetaTrader tool.
Before using any add-on, check its compatibility with MT4 or MT5, the symbol specifications and how it accounts for costs. A simple manual calculation also helps make sure you are reading the tool's output correctly.
Key tips and common mistakes in money management and setting the risk-to-reward ratio
To sum up, keep the following key points in mind in your money management and risk-to-reward calculations so you can avoid common mistakes as much as possible.
1. Don't move your stop loss without a reason just to change the ratio.
First determine at what price your reason for entering is no longer valid. Moving the stop loss closer for no reason, just to turn a 1 to 2 ratio into 1 to 4, can get you stopped out by normal price fluctuations.
2. The profit target must be backed by analysis.
If there is significant resistance between the entry and the buy target, you can't ignore it just to reach the ratio you want. An attractive ratio on the chart does not increase the chance of price reaching the target.
3. Don't confuse the ratio with the percentage of account risk.
Two trades with a 1 to 2 ratio can put 1 percent of the account at risk in one case and 10 percent in the other. For example, in a $5,000 account, a hypothetical 1 percent risk budget equals $50. Position size must be aligned with this budget and the stop loss distance. These figures are only calculation examples.
4. Don't leave costs out of the calculation.
Commission, spread and holding costs can reduce net profit. If the gross target profit and loss are $100 and $50 and you have a separate $5 cost on each outcome, the net profit becomes $95 and the final loss $55.
5. Don't treat a stop loss as a guarantee of exact execution.
During fast price moves or low liquidity, the exit may happen at a different price. The loss calculated before entry is an estimate based on assumed execution conditions.
6. Increasing leverage does not improve the ratio.
With entries and exits unchanged, higher leverage by itself does not change the profit-to-loss ratio. If you use it to take a larger position, both the profit and loss amounts get bigger.
7. Record actual results in a journal.
Alongside the initial ratio, write down the final profit and loss, partial exits and costs. Decisions about the right risk-to-reward ratio should rely on the performance of a set of trades; a few consecutive wins are not enough to judge.
Contents of this article


Related articles



User reviews

Newest
 Upload image