
Guide to Trading with the VWAP Indicator

Author
Hossein Haghshenas
Published
 2026/08/29
Updated
2026/10/25
Reading time
5 دقیقه


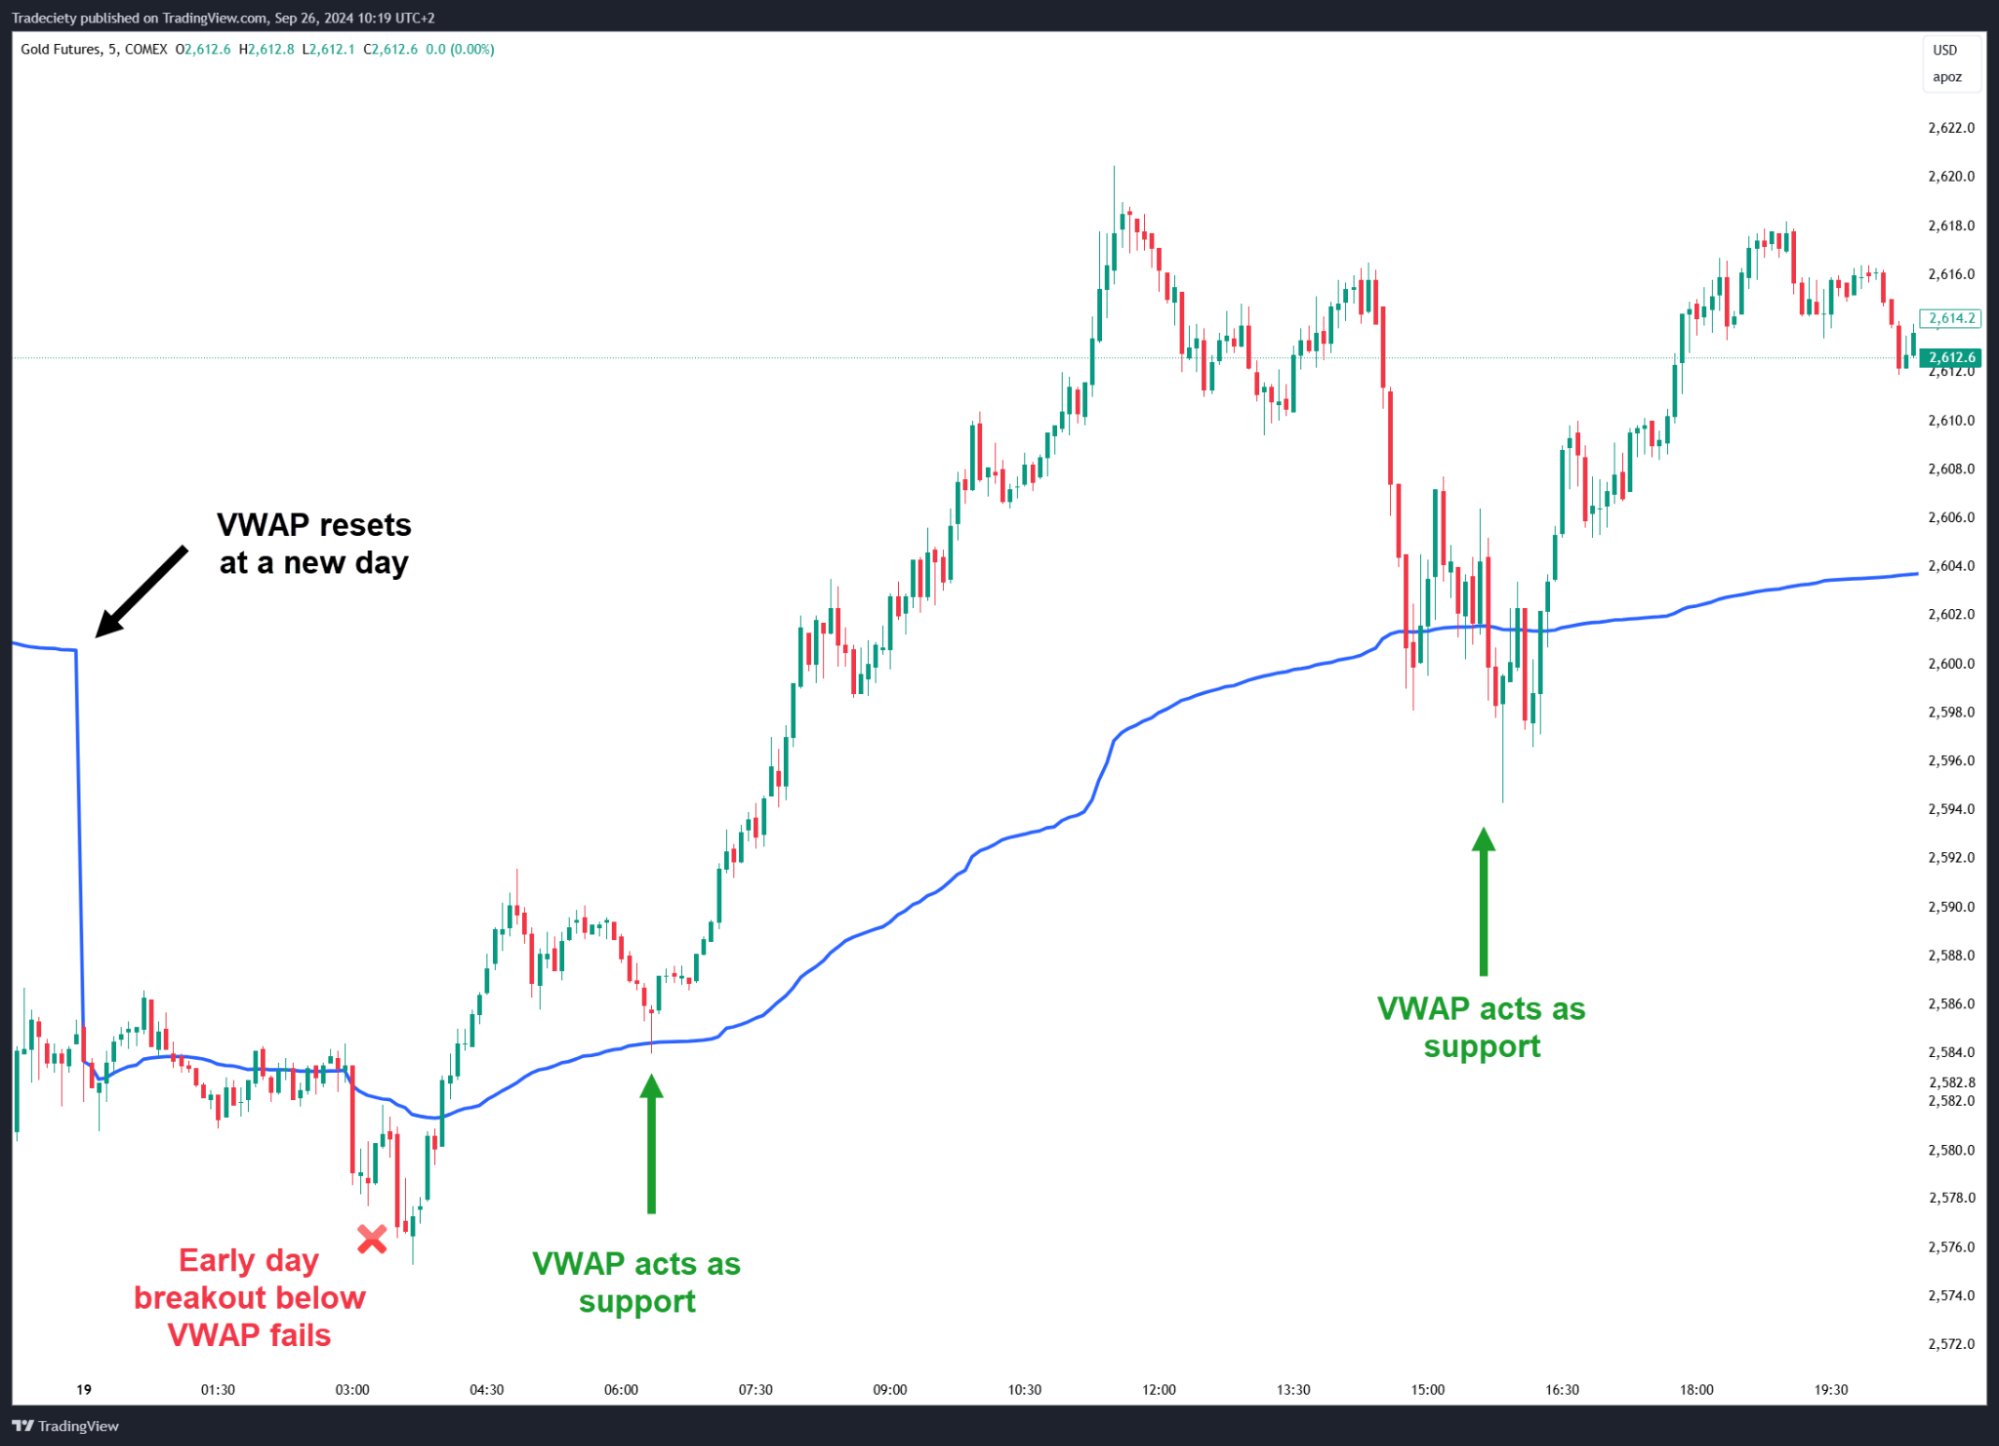
Imagine you are buying fruit at a market. If you want to calculate the average price of apples, simply adding up the prices and dividing by the number of apples won't give you the full picture. Apples sold in large quantities at a lower price should carry more weight in the average so you get a more realistic average market price. In the same way, in financial markets, the volume-weighted average price indicator, abbreviated as VWAP, does exactly this. It shows you in which range and at what volume most trades of an asset have taken place. Below, we'll learn how to trade using the VWAP indicator.
What Is the VWAP Indicator and How Does It Work?
The volume-weighted average price (VWAP) indicator is a technical analysis tool that calculates and displays the average price of an asset over a specific period, taking into account the trading volume at each price level. It gives traders a deeper view of the average price because it factors in trading volume; that is, prices at which more volume was traded carry more weight in the final average. This approach helps traders identify the price levels where the most trading activity has occurred.
VWAP works on the premise that high-volume prices reflect greater agreement between buyers and sellers. The indicator is therefore used as an important benchmark for assessing whether an asset is currently trading above or below its weighted average. Institutional traders and trading algorithms often use VWAP as a benchmark for executing large orders to make sure they trade at a price close to the market average. VWAP is similar to the Simple Moving Average, but it includes trading volume in its calculation.
Difference Between VWAP and the Simple (SMA) and Exponential (EMA) Moving Averages
The main difference between the VWAP indicator and the simple moving average (SMA) and exponential moving average (EMA) lies in how they weight price data. The SMA simply calculates the average of closing prices over a set period and gives all prices equal weight. The EMA also calculates the average of prices, but gives more weight to recent prices so that it is more responsive to price changes.
In contrast, VWAP takes trading volume into account in addition to price. This means prices accompanied by higher trading volume have a greater impact on the final VWAP value. This makes VWAP give a more accurate picture of an asset's "fair price" during a trading day, since it reflects the levels where the most trading activity took place. For this reason, VWAP is especially useful in intraday trading for identifying key support and resistance levels and assessing trade execution quality.
|
Feature |
VWAP |
SMA |
EMA |
|
Basis of calculation |
Price + trading volume |
Price |
Price |
|
Weighting method |
Trading volume gives prices more weight |
All prices have equal weight |
Recent prices have more weight |
|
Sensitivity to new prices |
Moderate, volume-dependent |
Lower |
Higher |
|
Considers trading volume |
Yes |
No |
No |
|
Core concept |
Average price based on trading volume |
Simple average of price |
Weighted average emphasizing recent prices |
|
Main use |
Measuring average price and trade execution quality |
Identifying trend and average price levels |
Faster identification of trend changes |
|
Use in day trading |
Very suitable |
Suitable |
Very suitable |
|
Use for support and resistance |
Suitable |
Suitable |
Suitable |
|
Suitable for intraday trading |
Very suitable |
Suitable |
Very suitable |
VWAP Indicator Formula and Calculation
Calculating the volume-weighted average price (VWAP) indicator involves several steps that carefully factor trading volume into the average price. This formula helps traders better understand an asset's average price while accounting for the importance of trading volume.
To calculate VWAP, you first need to calculate the "Typical Price" for each time period (for example, each candle). The typical price is the average of the High, Low and Close prices for that period:
`Typical Price = (High + Low + Close) / 3`
Next, this typical price is multiplied by the trading Volume of the same period to obtain that period's Volume Value:
`Volume Value = Typical Price * Volume`
Finally, to calculate VWAP, the sum of all Volume Values since the start of the trading session (usually the start of the day) is divided by the Total Volume over the same period:
`VWAP = SUM(Typical Price * Volume) / SUM(Volume)`
This calculation is done cumulatively throughout the trading day and resets at the start of each trading day to provide a clean signal. This daily reset ensures that VWAP reflects current trading activity and is not affected by data from previous days.
Why Is Using the VWAP Indicator Important in Trading?
Using the VWAP indicator matters a great deal in trading because it gives traders, especially intraday traders, a unique view of the market that other moving averages cannot provide. By taking trading volume into account, it helps traders identify the "fair" or "true" price of an asset during the trading day. This is especially crucial for institutional traders who need to buy or sell large amounts of stock, so they can execute their trades with minimal impact on the market price.
In addition, VWAP can act as a dynamic support or resistance level. When the price is above VWAP, it indicates that buyers are in control, and VWAP can act as support. Conversely, when the price is below VWAP, it indicates that sellers are in control, and VWAP can act as resistance. This helps traders identify better entry and exit points and apply Mean Reversion strategies. VWAP also helps traders evaluate their performance; if a trader buys a stock below VWAP, it means they bought at a better price than the market average.
How to Add the VWAP Indicator in TradingView and MetaTrader
Adding the VWAP indicator to trading platforms such as TradingView and MetaTrader (MetaTrader) is a relatively simple process and lets traders use this powerful tool in their analysis.
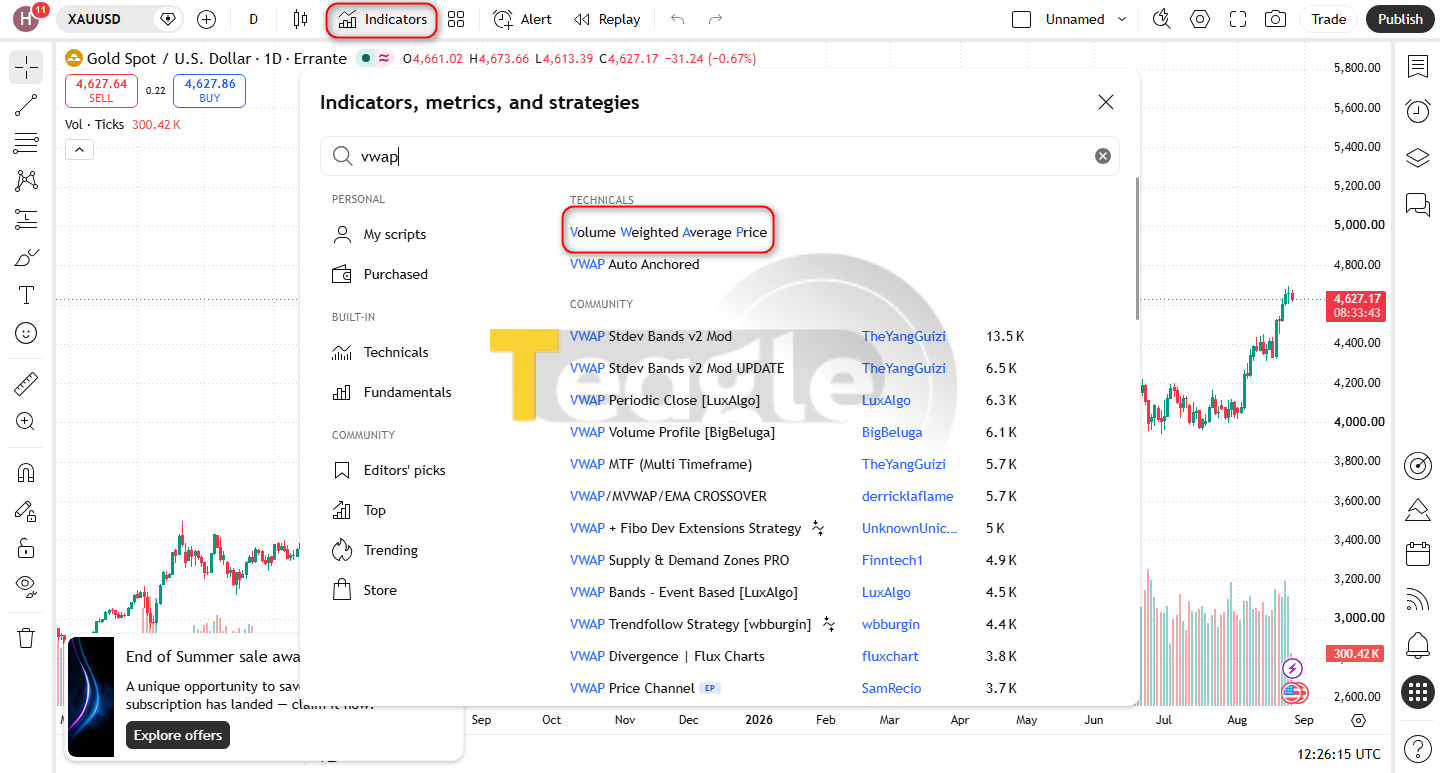
To add the VWAP indicator in TradingView , first open the chart of the asset you want. Then click the 'Indicators' tab at the top of the screen. In the search bar, type 'VWAP' and select the built-in 'Volume Weighted Average Price' option from the search results.
On MetaTrader 4 (MT4) and MetaTrader 5 (MT5), the VWAP indicator is not included in the indicator list by default. To add it, you need to download a custom indicator version of VWAP and add it to the 'Indicators' folder in your MetaTrader installation directory. After restarting MetaTrader, you can find the indicator under 'Custom Indicators' in the 'Navigator' window and drag it onto your chart. You can then change the color and line appearance settings to your liking.
Best Trading Strategies with the VWAP Indicator
Thanks to its weighted nature, the VWAP indicator is a very effective tool for developing various trading strategies. It can help traders identify trend direction, entry and exit points, and support and resistance levels.
Strategy for Identifying Trend Direction and Market Sentiment (Bullish or Bearish)
One of the main uses of VWAP is identifying trend direction and overall market sentiment. When an asset's price consistently trades above the VWAP line, it indicates that buyers are in control of the market and market sentiment is bullish. This can be a signal to enter buy positions, especially if the price moves back up after a pullback to the VWAP line.
Conversely, if the price consistently trades below the VWAP line, it indicates that sellers are in control of the market and market sentiment is bearish. In this case, traders can look for opportunities to enter short positions, especially if the price turns back down after a corrective move toward VWAP. This strategy helps traders move with the main flow of the market and avoid trading against the trend.
Mean Reversion Trading Strategy
The Mean Reversion strategy is another popular approach using VWAP. This strategy is based on the idea that prices tend to return to their average. When an asset's price moves significantly away from the VWAP line (whether upward or downward), the likelihood of it returning toward VWAP increases.
Traders can use this strategy to identify entry points. For example, if the price moves sharply away from VWAP and reaches the upper or lower Standard Deviation Bands that are commonly used alongside VWAP, this can indicate overbought or oversold conditions. In this case, traders can expect the price to return toward the VWAP line and adjust their trading positions accordingly.
Identifying Dynamic Support and Resistance Zones with VWAP
VWAP can act as a dynamic support or resistance level throughout the trading day. This means that, unlike static support and resistance levels that are determined based on previous highs and lows, VWAP changes continuously as price and trading volume change.
When the price moves up toward VWAP from below and reaches it, VWAP can act as a resistance level and push the price back down. Conversely, when the price moves down toward VWAP from above and reaches it, VWAP can act as a support level and push the price up. This feature helps traders identify pullbacks and mean reversion moves and spot key points without cluttering the chart. Standard Deviation Bands can also indicate overbought or oversold conditions in the context of the chosen timeframe and anchor.
Combining the VWAP Indicator with Complementary Indicators (RSI and MACD)
To improve the accuracy of trading signals, the VWAP indicator can be combined with other technical indicators. This combination helps traders get more confirmation for their decisions and avoid false signals.
For example, combining VWAP with the Relative Strength Index (RSI) can be very useful. If the price is above VWAP and RSI is not in the overbought zone, this can be a stronger buy signal. Likewise, if the price is below VWAP and RSI is not in the oversold zone, this can be a stronger sell signal. Combining it with the Moving Average Convergence Divergence (MACD) can also help identify changes in momentum. When the MACD line crosses its signal line and this happens at the same time as the price crosses VWAP in the direction of the trend, it can provide a stronger entry signal. VWAP can also be complemented with other indicators such as the volume profile.
Using the VWAP Indicator in Different Markets (Crypto, Forex and Stocks)
Because of its weighted nature, which takes trading volume into account, the VWAP indicator is a versatile tool that can be used in various financial markets, including crypto, forex and stocks. However, how it is applied and how effective it is may vary depending on the characteristics of each market.
In the stock market, VWAP is widely used by institutional traders and trading algorithms to execute large orders. These traders try to buy shares at a price close to VWAP to avoid having a large impact on the market price and to get the best possible price. VWAP is mainly suited to stock trading, but it can also be used in the futures market. In the crypto market, which has high price volatility and where trading volume can change quickly, VWAP can help traders identify key price levels where the most trading activity has occurred. This is especially useful for intraday trading in volatile cryptocurrencies. In the forex market, which has very high trading volume and is often active 24 hours a day, VWAP can help traders assess the volume-weighted average price of currency pairs over a trading day or a specific period. Although VWAP is not as common in forex as it is in stocks or crypto, it can be useful for identifying dynamic support and resistance levels and assessing the overall market direction on short-term timeframes.
Advantages and Limitations of Using the VWAP Indicator in Trading
The VWAP indicator is a powerful tool in technical analysis that offers significant advantages for traders, but like any other tool, it also has limitations that should be taken into account. Understanding these advantages and limitations helps traders use VWAP more effectively.
One of the main advantages of VWAP is that it provides an objective, weighted measure of price. By taking trading volume into account, VWAP offers a more accurate picture of an asset's "fair price" over a trading period, which is especially vital for institutional traders and trading algorithms for the optimal execution of large orders. VWAP can act as a dynamic support or resistance level and help traders identify pullbacks and mean reversion moves. In addition, this indicator resets at the start of each trading day to provide a clean, undistorted signal, which makes it very suitable for analysis on intraday timeframes. A price above VWAP indicates that buyers are in control, while a price below VWAP indicates that sellers are in control.
However, VWAP also has limitations. This indicator is mainly designed for analysis on intraday timeframes and may be less effective on longer timeframes (such as daily or weekly), because it resets at the start of each day. Also, VWAP is a lagging indicator, meaning it is calculated from past data and cannot predict the future. Furthermore, in low-volume markets or at times when trading volume is very low, the accuracy of VWAP may decrease. Finally, while VWAP is an objective indicator, the trading strategies traders build on it are inherently subjective, and there is no single right or wrong way to use it, which increases the need for the trader's experience and interpretation. Below is a summary of the advantages and disadvantages of this indicator.
|
Advantages |
Limitations |
|
Takes trading volume into account |
Better suited to intraday trading |
|
Provides an objective measure of price |
Lagging indicator |
|
Identifies support and resistance |
Reduced accuracy in low-volume markets |
|
Identifies pullbacks and mean reversion |
Depends on the trader's interpretation |
|
Measures the strength of buyers and sellers |
Does not provide definitive signals |
|
Useful for evaluating trade execution |
Needs to be combined with other tools |
Contents of this article


Related articles



User reviews

Newest
 Upload image