
What Are the Types of Financial Market Analysis?

Author
Admin
Published
 2026/03/30
Updated
2026/10/31
Reading time
5 دقیقه


Listen to the audio version of this article here.
Financial markets offer many opportunities, but they are also high-risk. Making decisions in this space requires careful analysis, because guessing about price behavior, investor reactions and economic trends cannot give us a profitable trading experience. Every analysis is really an attempt to understand the hidden order within fluctuations and changes, from examining numbers and charts to paying attention to political events and investor psychology.
Professional investors rely on different analysis methods, from technical and fundamental analysis to behavioral and quantitative analysis, to build a more accurate picture of the market's future and clarify their decision-making path. The Teagle team is here to help you, by analyzing the types of financial markets and the features of each, take confident and well-calculated steps on your investment path.
What does financial market analysis mean?
Financial market analysis is a precise and detailed process for better understanding prices, forecasting the future and making profitable choices. When we talk about financial market analysis, we mean a set of methods and tools that analysts and investors use to understand fluctuations in the stock market, forex or crypto .
Every analyst tries to understand why the price of an asset rises or falls. In fact, the main goal of financial market analysis is to help investors choose the best time to buy or sell. In short:
Financial market analysis means interpreting and explaining the behavior of numbers, charts and economic news to make smart financial decisions.
Types and methods of financial market analysis
To better understand the complexity of financial markets, experts use various types of financial market analysis.
The most important methods of financial market analysis fall into four main categories:
1) Technical analysis
2) Fundamental analysis
3) Sentiment analysis, or market psychology
4) Quantitative and data-driven analysis
Technical analysis
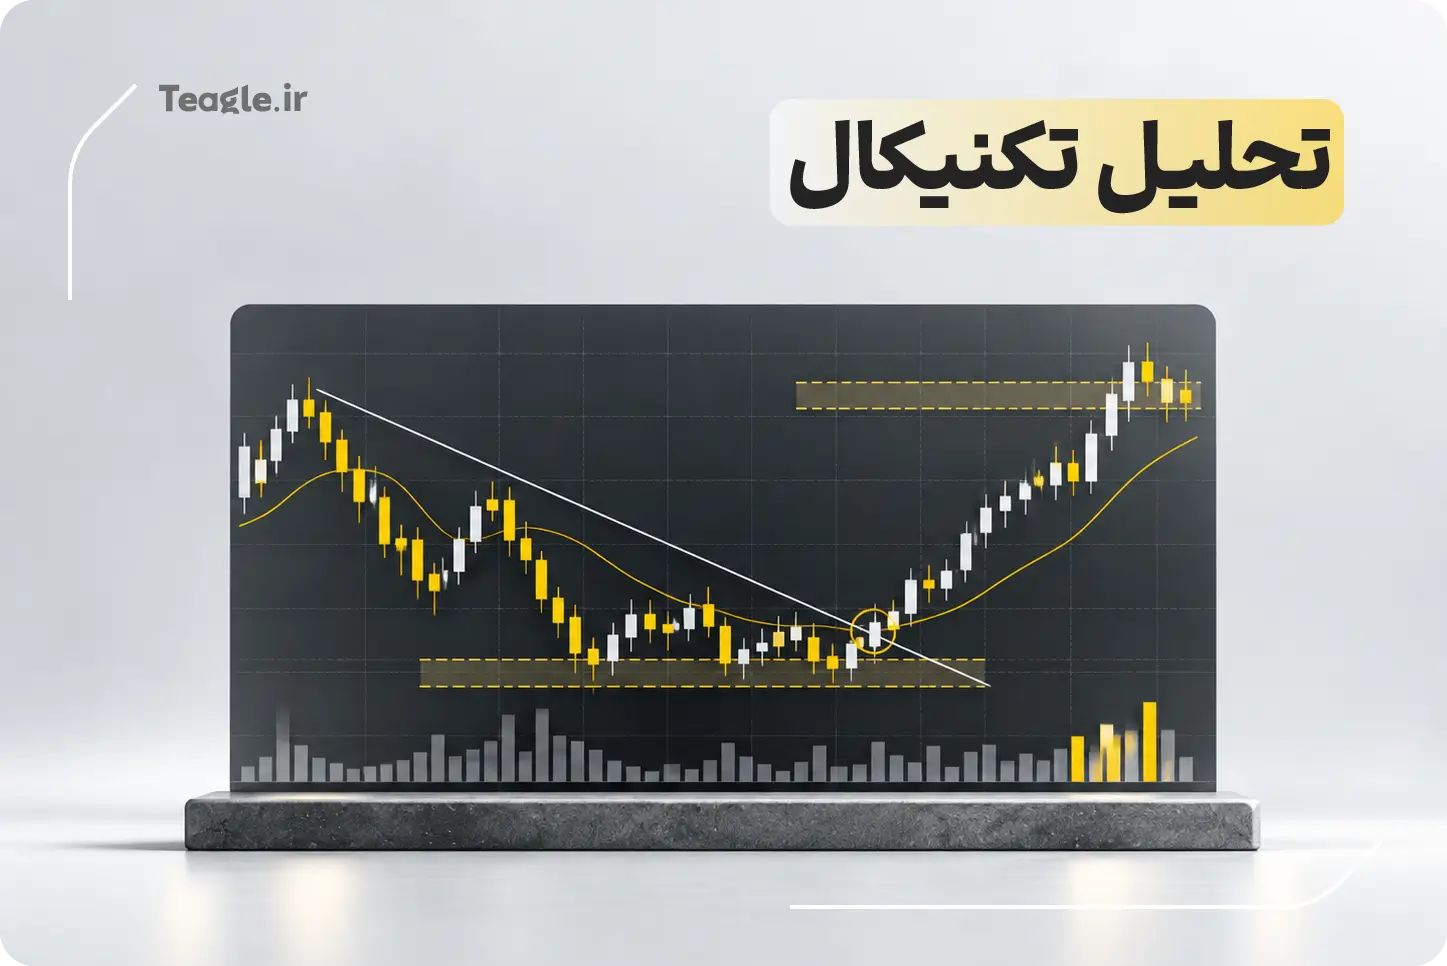
Technical analysis of financial markets is one of the most popular methods among traders. This method is based on examining price charts and trading volume. This type of analysis assumes that all available information is already reflected in the price.
A technical analyst tries to study past price behavior to examine possible scenarios for future market movement. Technical analysis can be used in all markets (stocks, forex, gold and crypto).
Common tools in technical analysis
An important part of learning analysis is getting to know analysis tools . These tools help traders assess the financial market more accurately:
|
Tool category |
Example |
Use |
|
Indicators |
RSI, MACD, Bollinger Bands |
Measuring price momentum and identifying reversal points |
|
Chart patterns |
Head and shoulders, flag, triangle |
Identifying trends and breakout points (Breakout) |
|
Trend lines and support/resistance |
|
Forecasting trend continuation or reversal |
|
Fibonacci and Ichimoku |
Combined tools |
Fibonacci: identifying key price levels (retracement and extension) Ichimoku: multi-component analysis of trend, momentum and support/resistance |
Using technical analysis in stocks, forex and crypto
In short, technical analysis is a tool for recognizing recurring patterns and detecting the collective sentiment of the market.
|
Market |
How technical analysis is used |
Key points |
|
Iran stock exchange |
Reviewing stock charts and retail and institutional trading volume |
Focus on supports, resistances and divergences |
|
Forex |
Analyzing currency pairs (USD/EUR, GBP/JPY etc.) |
Importance of timeframes and short-term trading |
|
Crypto |
Continuous monitoring of Bitcoin and altcoins |
High volatility, better analysis with faster indicators |
Fundamental analysis
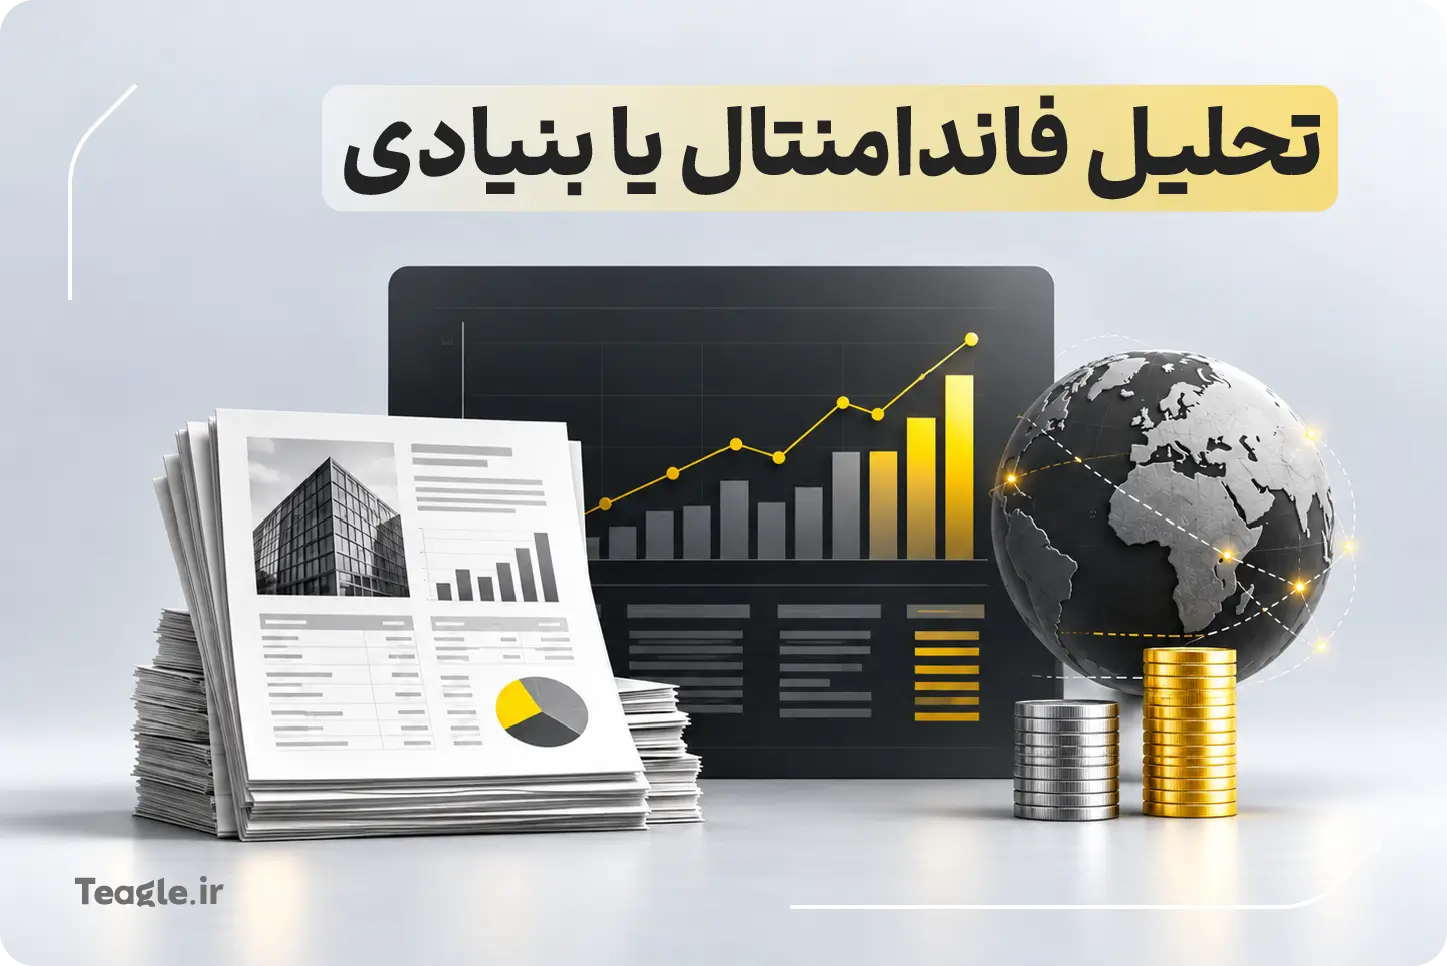
Unlike technical analysis, which focuses on price, fundamental analysis (Fundamental Analysis) focuses more on the intrinsic value of an asset. In this type of analysis, the goal is to uncover the real value of a company, currency or asset and then compare it with the current market price.
Financial market analysis methods is usually built on financial, economic and even political data. As a result, a deep understanding of the economic situation of the country or company under review is necessary.
Reviewing financial statements, EPS, P/E, Codal reports
In fundamental analysis of the Iran stock exchange, the priority is reviewing financial documents such as:
- EPS (earnings per share): shows how much profit the company has generated per share.
- P/E (price-to-earnings ratio): the lower it is, the more valuable the stock is considered.
- Codal reports: In Iran, the codal.ir website is the official source for publishing companies' financial reports.
- Balance sheet and income statement: By reviewing these documents, an analyst can determine whether a company is financially healthy or not.
For example, if a company has a high EPS and a low P/E ratio, this is usually an early sign that the stock is undervalued.
Macroeconomic analysis and the impact of global news
Financial markets are heavily influenced by the state of the macroeconomy and global news. Inflation, changes in bank interest rates, wars and the monetary policies of central banks are among the decisive factors.
For example, we all know that the US Federal Reserve's decision on interest rates has an immediate effect on the forex market , and a change in global energy policy can affect Iranian listed companies such as petrochemical firms. As a result, in addition to company data, a fundamental analyst must also have a solid grasp of the macroeconomic environment.

Sentiment analysis or market psychology
Sentiment analysis (Sentiment Analysis), or market sentiment analysis, is a method of examining financial markets that helps identify the prevailing attitude of market participants. This type of analysis helps us understand whether the overall market mood is optimistic or pessimistic. One of the tools used for sentiment analysis is the Fear and Greed Index (Fear & Greed Index); if the index is moving toward greed, it can be a sign of rising prices or buying frenzy. On the other hand, if the index is moving toward fear, the market usually sees increased selling pressure and reaches a price bottom.
Quantitative and data-driven analysis
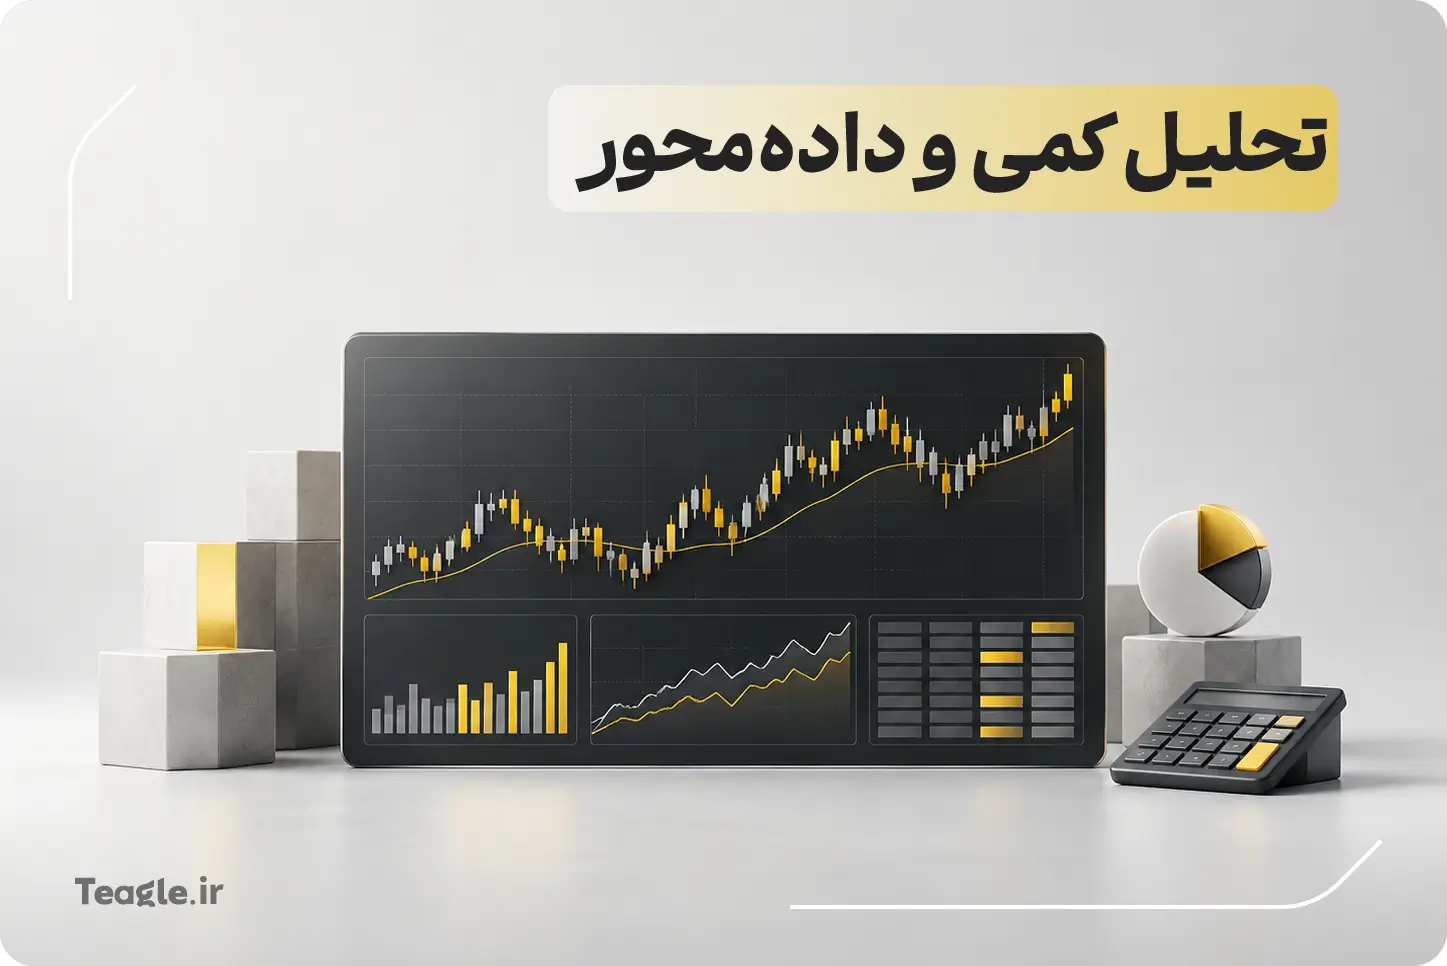
Recently, the use of big data (Big Data) and statistical algorithms in financial market analysis has become very common. In quantitative analysis, the trader or analyst uses mathematical models to predict prices. For example:
1. Analyzing correlation between assets
2. Modeling the risk of a portfolio based on historical volatility
3. Using artificial intelligence to recognize price patterns
4. Using machine learning algorithms to identify buy or sell opportunities
The difference between quantitative and qualitative analysis
It is this fundamental difference between quantitative (Quantitative) and qualitative (Qualitative) analysis that determines the direction of a choice, not only in finance but in the same way in the social sciences and business.
Quantitative analysis (Quantitative Analysis) focuses entirely on measurable, numerical and statistical data; in financial markets, this approach seeks to answer questions that can be proven with numbers. Qualitative analysis (Qualitative Analysis), on the other hand, deals more with understanding factors that cannot easily be measured in numbers and figures.
In short, quantitative analysis excels at measurement and mathematical proof, while qualitative analysis is based on interpretation, analytical experience and the examination of non-numerical factors. To make a smart decision, we recommend that you use both approaches.
|
Feature |
Quantitative analysis |
Qualitative analysis |
|
Data type |
Numerical, measurable |
Descriptive and interpretation-based |
|
Tools |
Statistical models, software, artificial intelligence |
News analysis, interviews, market observation |
|
Goal |
Modeling price behavior, measuring risk and building trading strategies |
Understanding investor mindset and management behavior |
|
Example use |
Trading algorithms |
Analysis of management reports |
What is the best method for analyzing financial markets?
There is no definitive answer to this question, because each method has its own function. However, combining several methods gives better results. For example:
1. Start with fundamental analysis: to select suitable assets
2. Confirm with technical analysis: to determine entry and exit points
3. Monitor with sentiment analysis: to gauge market sentiment
4. Support with quantitative analysis: for data mining and more precise algorithms
|
Type of analysis |
When to use |
Suitable for |
|
Fundamental |
Long-term analysis |
Fundamental investors |
|
Technical |
Short and medium term |
Traders and swing traders |
|
Sentiment |
Assessing sentiment and the psychological climate of the market, especially when major news is released |
Market sentiment analysts |
|
Quantitative |
Automated systems |
Algorithmic and big data traders |
The importance of financial market analysts
Financial market analysts are responsible for translating raw economic information into actionable decisions. Their job goes beyond simply predicting prices; they are in fact a vital bridge between complex information and your informed decision-making. Every day a huge volume of news, economic data, company reports and political developments is published, and analysts act as filter, interpreter and translator.
By processing raw data and removing the effects of market noise, this information is turned into simple, strategic insights that can be used directly. Without these specialists, market transparency would decline, leaving a market in which people cannot separate important information from rumors.
For this reason, the role of good, experienced analysts in maintaining market efficiency and transparency is irreplaceable. By providing accurate, well-documented reports, they help allocate financial resources optimally. This means they steer capital toward companies and assets with real growth potential. On the other hand, for retail investors, an analyst acts like a map and guide, identifying hidden risks and pointing out opportunities that may not be visible at first glance. Ultimately, trust in markets and the continued flow of investment depend to a large extent on the credibility and accuracy of these specialists, although this is not the only factor.
Related articles
Contents of this article


Related articles



User reviews

Newest
 Upload image